
Stats Global view
This section shows live statistics for all LSLB farms, including information related to connections Established and Pending and information related to the IPDS module, protection against attacks.
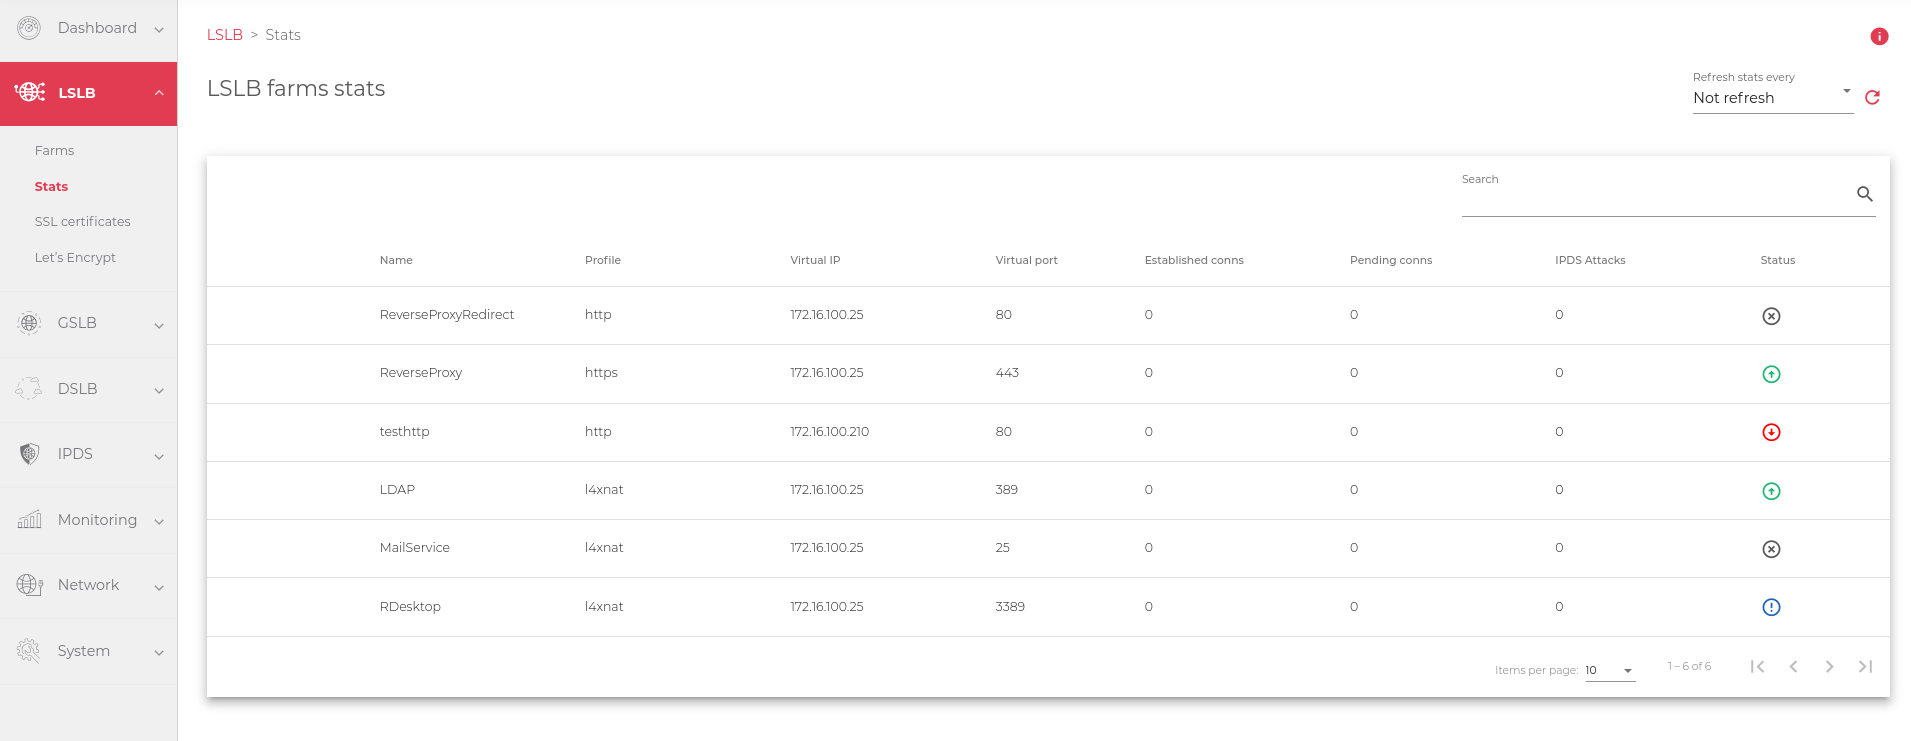
The stats table includes the following columns:
Name: The name of the farm or virtual server.
Profile: The protocol type that the LSLB farm is using (HTTP, HTTPS, or L4xNAT).
Virtual IP: The IP address used by the virtual server to handle requests. This IP will be connected by clients.
Virtual Port: The ports used by the virtual server to listen for requests. This Port will be connected by clients.
Established Conns: The number of opened HTTP(S) connections from clients to the Virtual Port of the farm.Pending Conns: The number of not established connections from clients to the Virtual Port of the farm, these connections should change to established as soon as possible.
IPDS Attacks: This is the total number of attacks a particular farm has received. These attacks could stem from Blacklists, DoS, RBL, WAF, etc.
Status: The status of the farm, can be one of the following:
- Green or UP: The farm is running and all servers are up.
- Red or DOWN: The farm is down or has stopped running.
- Yellow or NEEDED RESTART: The farm needs to be restarted, due to recent changes that need to be applied.
- Black or CRITICAL: The farm is up but no servers are available, or all servers are in maintenance mode.
- Blue or PROBLEM: The farm is running but at least one server is down.
- Orange or MAINTENANCE: The farm is running but at least one server is in maintenance mode.
By default, the stats show live data for the connections of each LSLB farm. You can also set the stats to refresh automatically every 10, 30, 60, or 120 seconds.
Show Backends

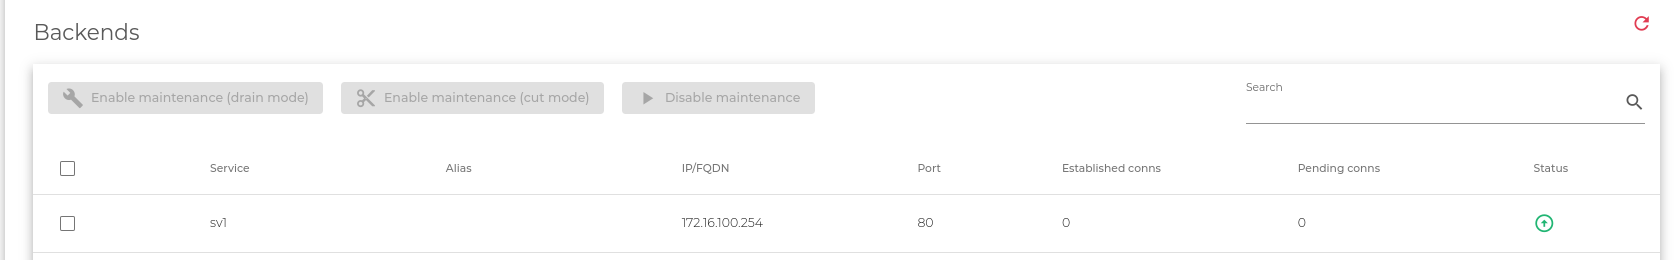
The columns in this table include:
Service: The name of the farm service where the backend is configured. This column only appears in HTTP(s) farms.
Alias: The alias of the backend, if one is configured.
IP/FQDN: The IP address of the backend or FQDN, DNS input.
Port: The port of the backend.
Established Conns: The number of established connections to the backend.
Pending Conns: The number of pending connections to the backend.
Status: The current status of the backend. The following status color codes are used:
- Green or UP: The backend is running normally.
- Orange or MAINTENANCE: The backend is in maintenance mode.
- Red or DOWN: The farm is up but the backend is unreachable.
Sessions Table
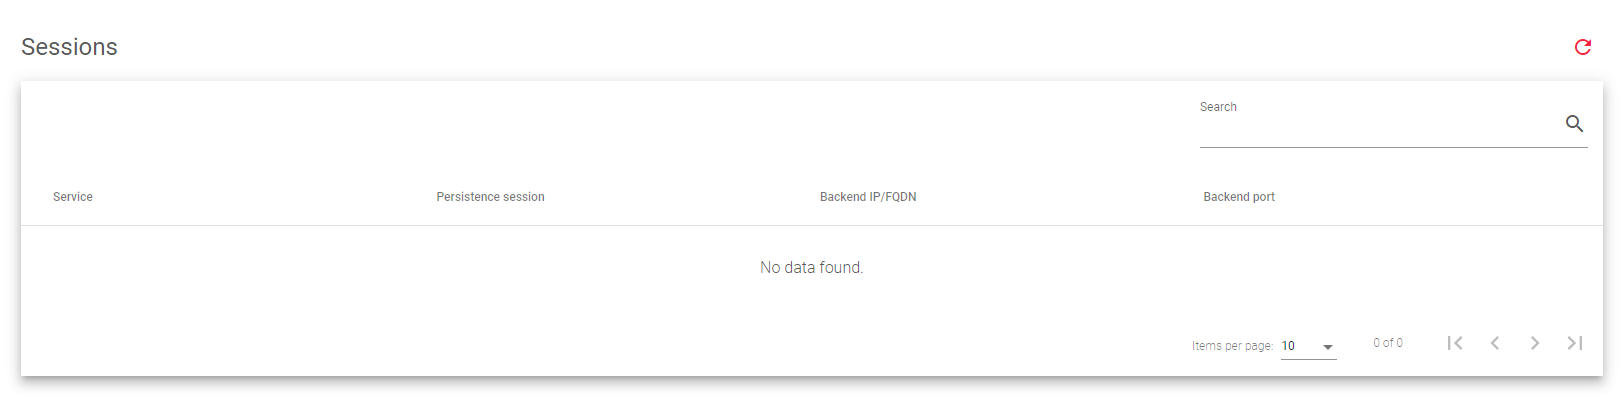
This table shows the established sessions for each backend server. The columns in this table are:
- Service: The name of the farm associated with the client session.
- Persistence session: The identifier used for the persistence between the client and the backend.
- Backend IP: The IP address of the backend server to which the session is connected.
- Backend PORT: The port of the backend server to which the session is connected.
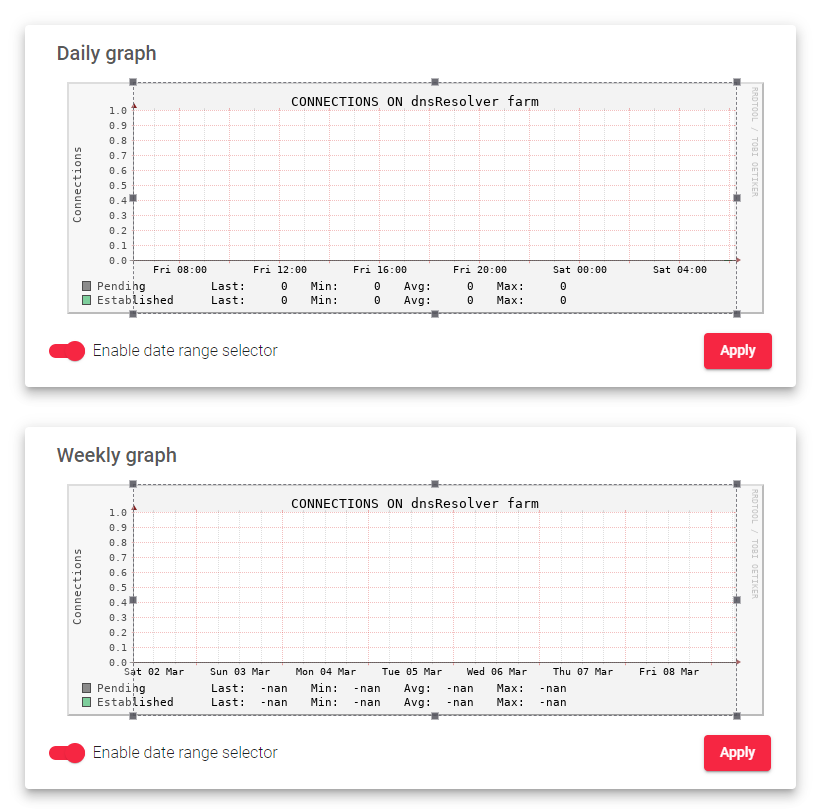
Show Graphs

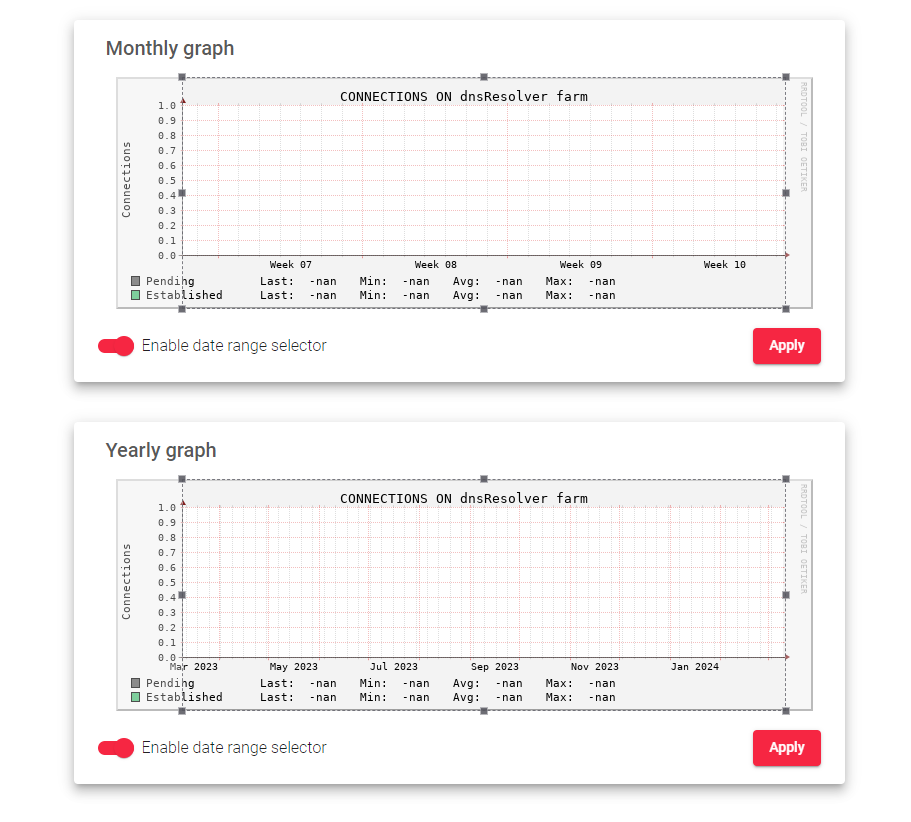
This section shows graphs of the Established and Pending connections for current the farms over four time periods: The Daily, Weekly, Monthly, and Yearly.
The types of connections that are counted are:
- Established: These connections have been confirmed and are marked as ESTABLISHED. For L4xNAT profile farms, this means that there is a connection to the backend server. For HTTP profile farms, this means that there is a connection to the virtual server.
- Pending: These connections are marked as SYN and have not been confirmed yet. An increase in the number of pending connections means that a higher rate of requests is being received and is not being served.
Each graph also shows the following information:
- The last value that was gathered.
- The minimum, maximum, and average values.
- The Enable data range selector toggle button selects a range of dates from which the data is to be analyzed.
Show IPDS stats

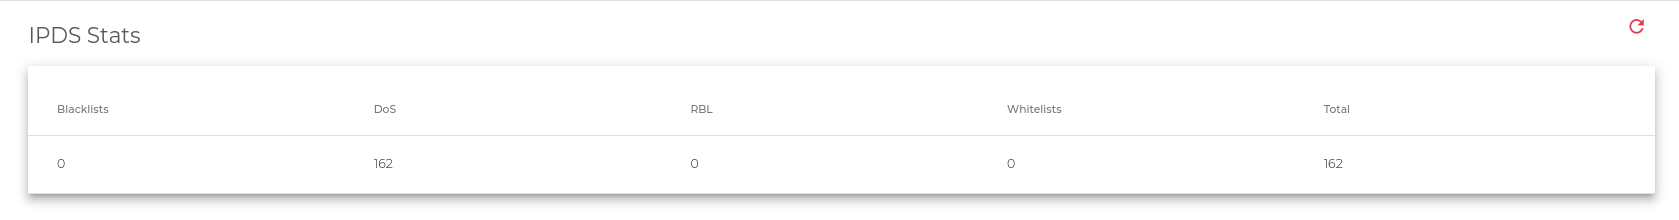
This section shows the stats of the IPDS module
The types of information shown in this view are the following:
- Blacklists: Information related to the number of attacks stopped by this module inside the IPDS system.
- DoS: Information related to the number of attacks stopped by this module inside the IPDS system.
- RBL: Information related to the number of attacks stopped by this module inside the IPDS system.
- Whitelists: Information related to the number of attacks stopped by this module inside the IPDS system.
- WAF: Information related to the number of attacks stopped by this module inside the IPDS system.
- Total: A summary of all attacks stopped by all the modules inside the IPDS system.
The stats for the IPDS module and the farm are initiated to 0 nightly at 00:00, in case you need to check stats for a previous period please go to Monitoring > Reports
