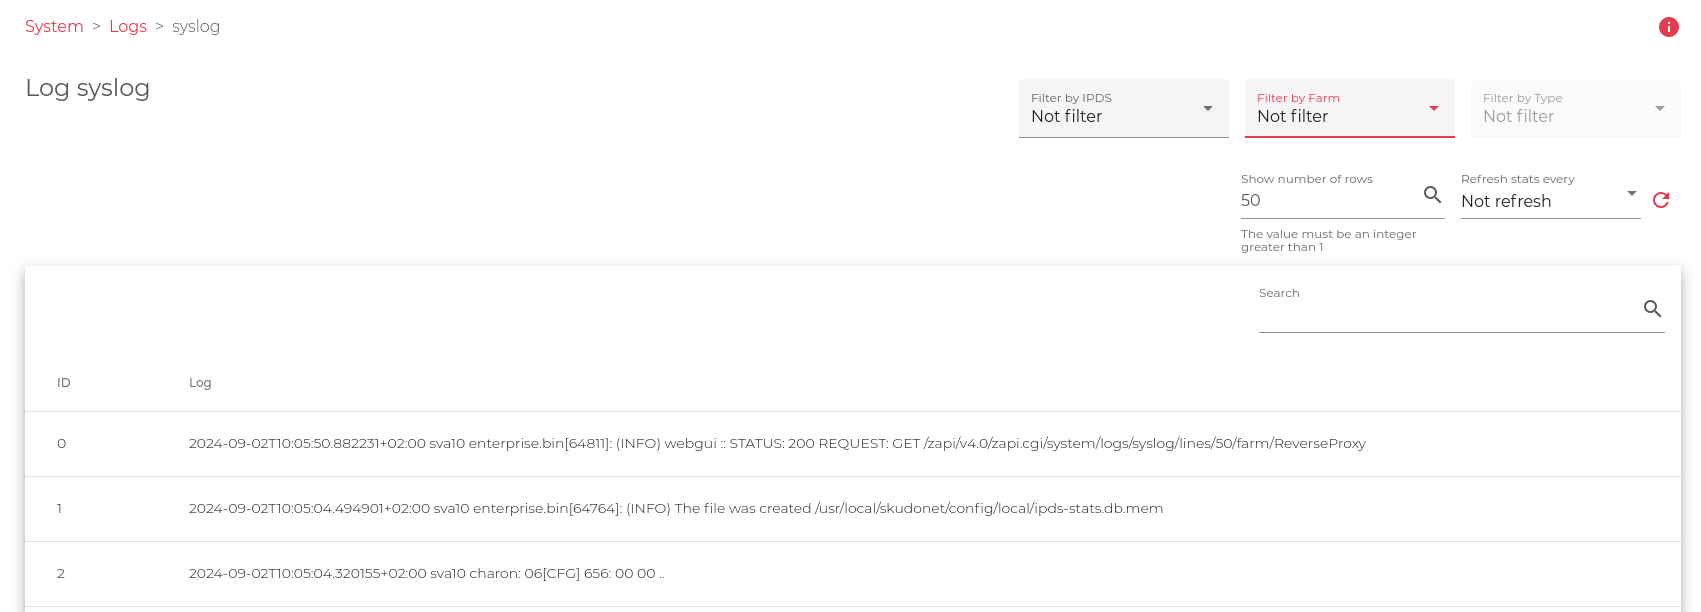
The Show action opens a new screen for managing the log file display. In this section, you may select the desired number of files to show, starting with the latest entries. One may also utilize the search filter to refine the log content and narrow down his search.
To show log files:
-
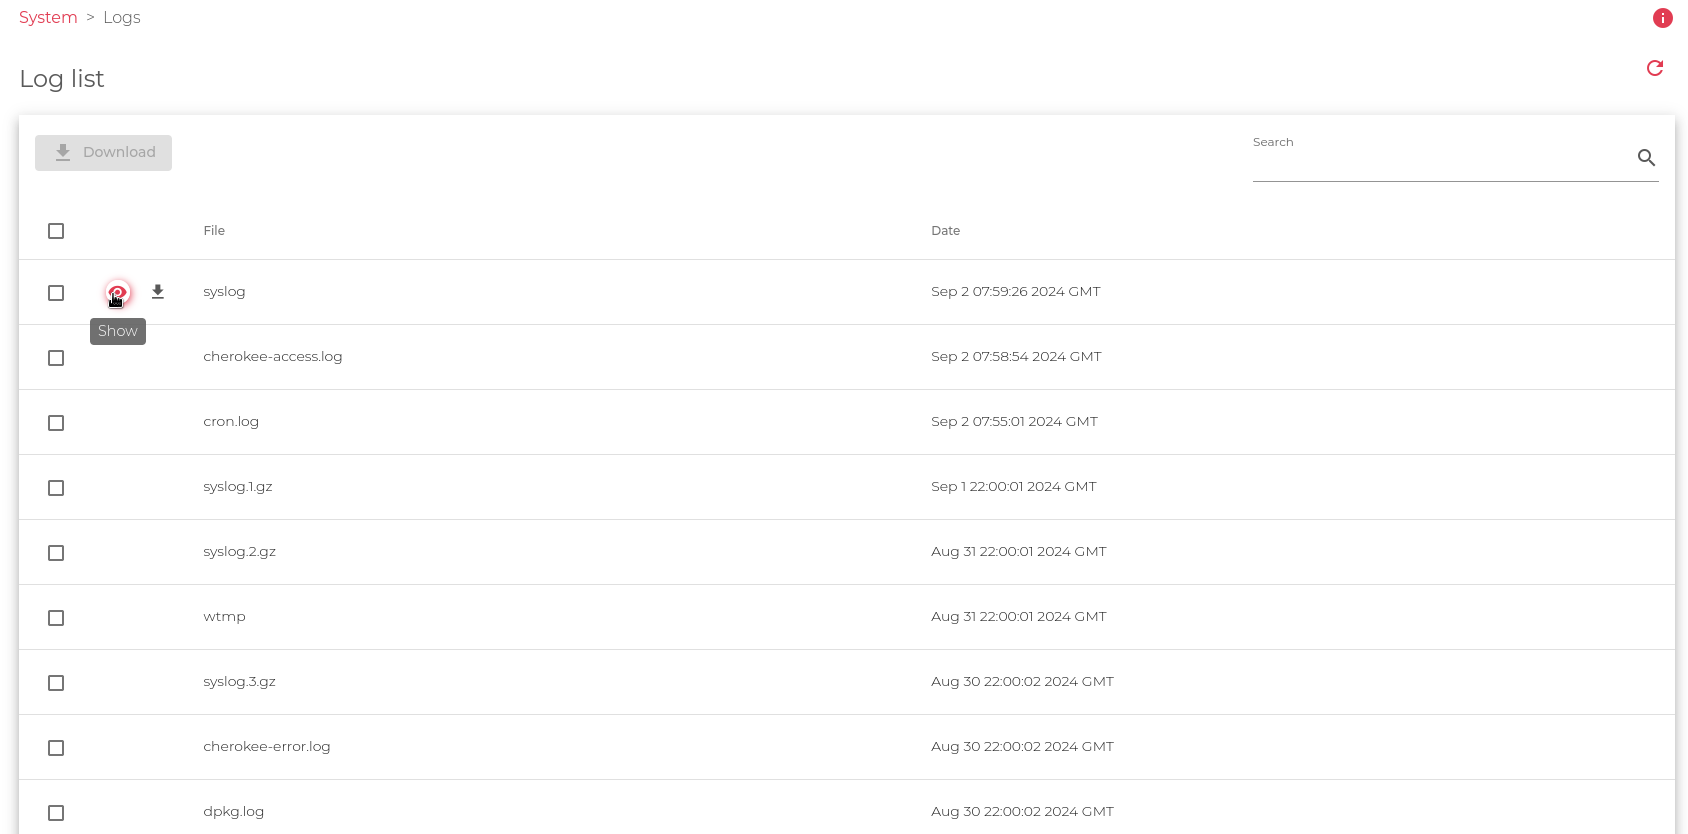
- Go to the Systems > Logs section.
- Hover over the log file you’d like to analyze and click the Show Icon.
A new page with logs will appear, like the one shown in the image below.
This form is ready to read the logs in raw mode and apply filters, those filters show the log information in different formats that let the system administrator understand better the information. Let us focus in the upper right section, this part works as a filter that gives the following information:
- Filter by IPDS: This view filters IPDS events in the log, those events are related to the different security modules inside IPDS, like Blocklist, DoS, RBL and WAF. SKUDONET v10 includes log formatting for WAF making the information more readable.
- Filter by Farm: This view filters information in the logs based on the selected farm, a full list of configured farms will be loaded in this filter.
- Filter by type: Once the farm is selected this filter can be applied to prepare the logs in columns in a more readable way.
Let’s show the different Log views and the information we can obtain from each one.
WAF Logs for a Certain Farm.
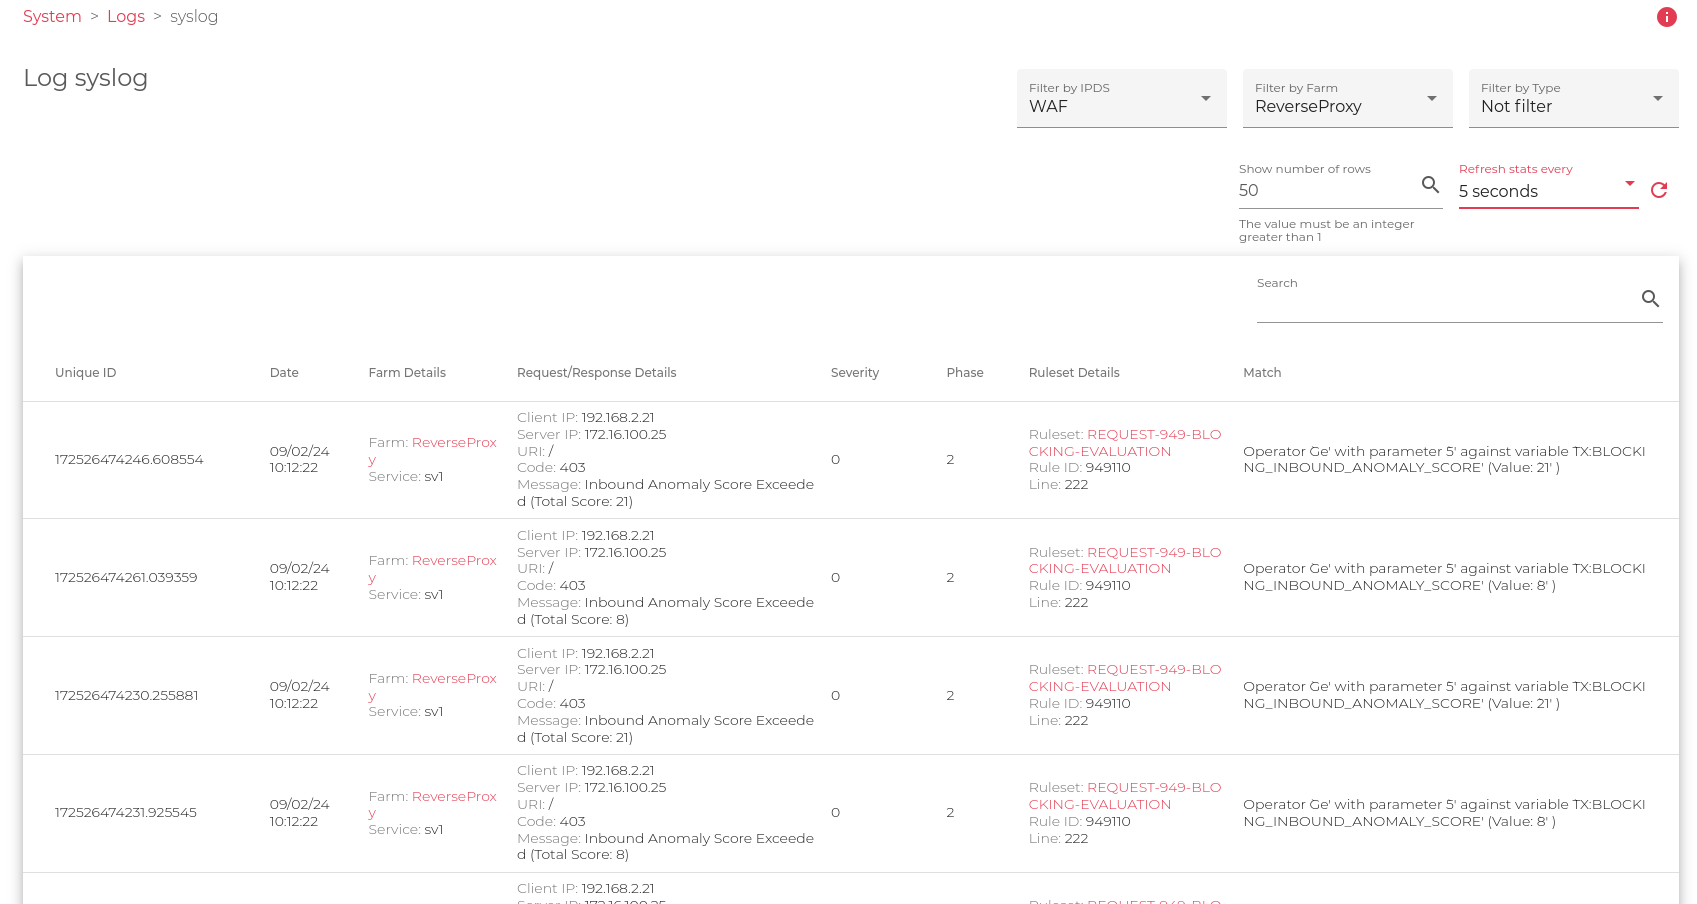
The previous filter shows all the WAF events found in the farm ReverseProxy, ordered by columns. (Filter by IPDS = WAF, Filter by Farm = ReverseProxy, update every 5 seconds)
- Unique ID: Unique identifier assigned by the WAF Engine, this value is useful to search which rule applied to wich event.
- Date: Where the event was triggered.
- Farm Details: The farm that received the request and the service that processed the request. If WAF applied a 403 or a Redirect then the request didn’t reach the backend.
- Severity: 0. The severity level is configured for each rule and can be changed if required. The possible values for severity are: 0 – EMERGENCY 1 – ALERT 2 – CRITICAL 3 – ERROR 4 – WARNING 5 – NOTICE 6 – INFO 7 – DEBUG.
- Phase: 2 is the phase in the HTTP(S) communication where the WAF rule action has triggered. Phase 1: REQUEST HEADERS, Phase 2: REQUEST BODY, Phase 3: RESPONSE HEADERS, Phase 4: RESPONSE BODY, Phase 5: LOGGING.
- Ruleset Details: Information related to the request that was triggered, this information allows us to find the exact rule inside the fully loaded seclang ruleset in this farm. All the rules are saved in the Path:/usr/local/skudonet/config/ipds/waf/sets.
- Match: Once the previous rule is triggered a reason is saved in the logs for future reference. This gives you information about the reason why the WAF security module triggered this transaction.
Access Logs for certain Farm.
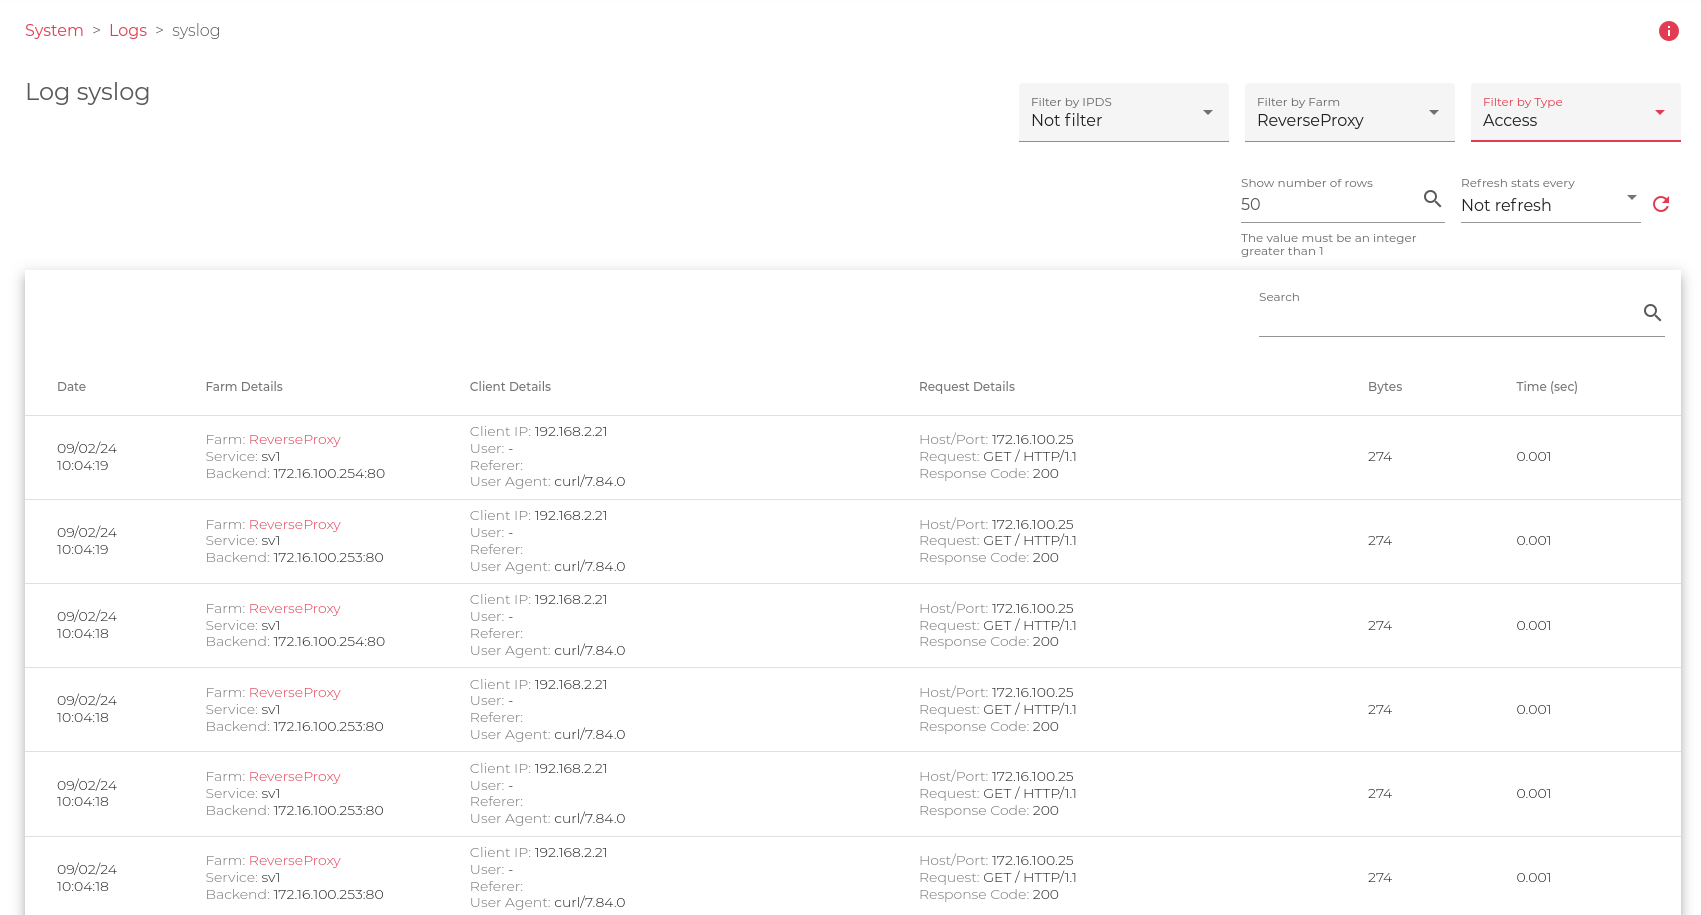
The previous filter shows all the WAF events found in the farm ReverseProxy, ordered by columns. (Filter by Farm = ReverseProxy, Filter by Type = Access, update every 5 seconds)
Date: Where the event happened.
- Farm Details: Information related to the farm that received the request, the service that managed the request and the backend that received the request.
- Client Details: Information related to the client, as source IP, User in case there is a registered user in Basic mode, User-Agent or client browser, Referer or latest request that connected to before this one.
- Request Details: Host Header requested by the client, Request sent by the client and Response code sent by the backend.
- Bytes: Total of bytes replied to the client
- Time: Time expected by the backend in responding to the request GET / to the client 192.168.2.21.
Next Article: System | User Settings


