
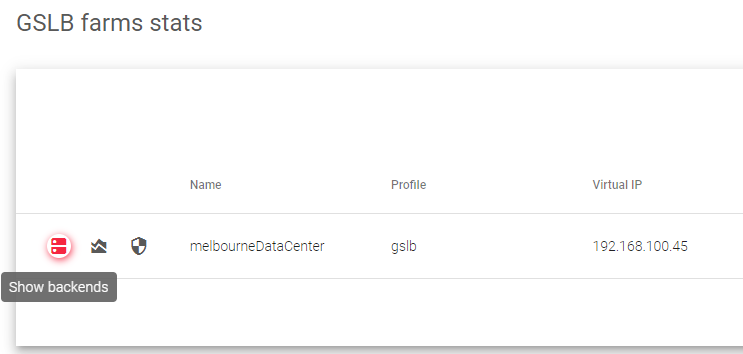
The GSLB Farm Stats page shows real-time statistics for all GSLB farms, including the number of Established and Pending connections for each farm.

The stats table includes the following columns:
Name: The name of the farm or virtual server.
Profile: Indicates that the profile is for a GSLB farm.
Virtual IP: The IP address that the farm uses to handle requests.
Virtual Port: The port that the farm uses to handle requests. The default Port is 53.
Established Conns: The number of connections that are marked as ESTABLISHED and are currently processing traffic.
Pending Conns: The number of connections that are marked as SYN. An increasing value indicates that the farm is receiving more requests than it can serve.
IPDS Attacks: The number of connections stopped by the IPDS module, this value is reset daily at midnight and the value is a summary of Blocklist, Whielists, Dos and RBL rules.
Status: The status of the farm, which is indicated by one of the following colors:
 Green: UP: The farm is running and all backends are UP.
 Red: DOWN: The farm is stopped and not managing traffic.
 Yellow: RESTART NEEDED: There are recent changes that need a farm restart to be applied.
 Black: CRITICAL: The farm is UP but there are no backends available or they are in maintenance mode.
 Blue: PROBLEM: The farm is running but at least one backend is down.
 Orange: MAINTENANCE: The farm is running but at least one backend is in maintenance mode.
By default, the stats table shows static data for the connections of each GSLB farm. However, you can set the table to auto-refresh every 10, 30, 60, or 120 seconds.
Show backends
This section provides a detailed overview of the GSLB farm’s current status, including Backend statistics, Client requests, Server requests, and Extended statistics.
To show backend stats, click the Show Backends button as shown in the image below.
Backend
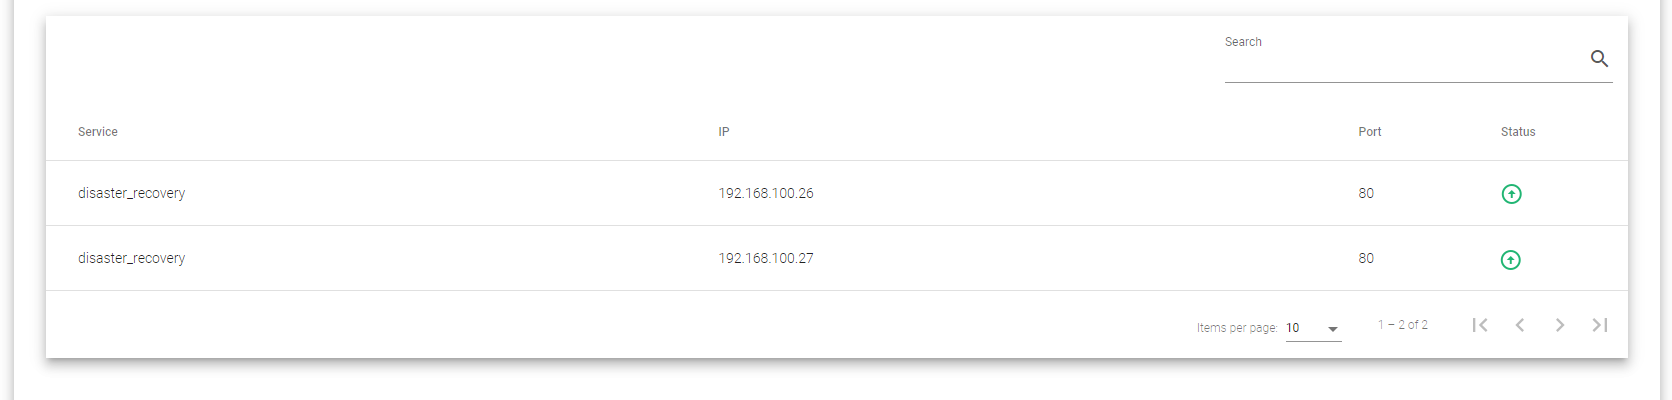
The Backend Stats table shows the following information:
Service: The name of the farm service.
IP: The IP address of the backend server.
Port: The TCP port of the backend server to be checked.
Status: The current status of the backend server, which can be one of the following:
- Green: The backend server is UP and running normally.
- Red: The backend server is unreachable, but the farm is still UP.
- Grey: The status of the backend server is unknown. This can happen when the farm is stopped and the backend server is not in maintenance mode.
Client
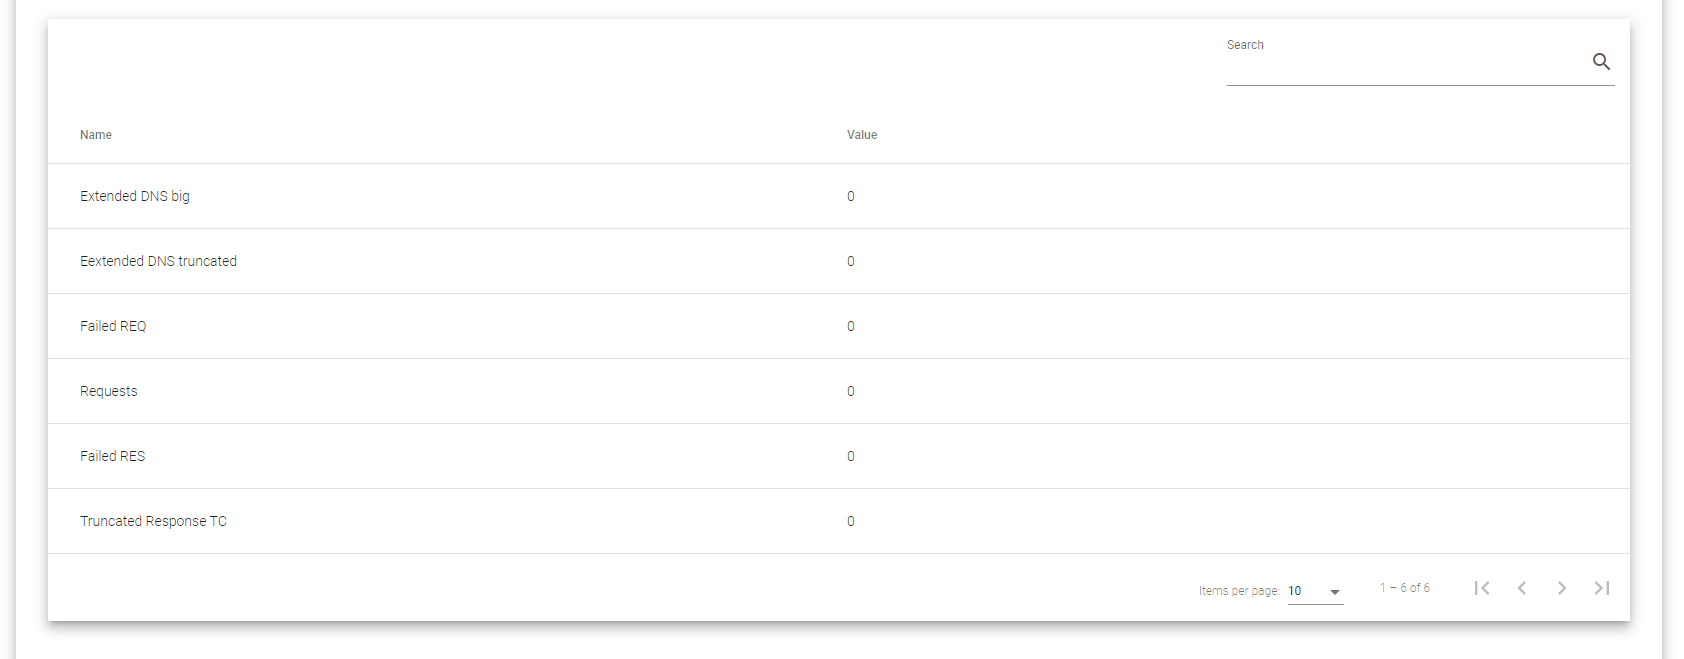
The Client Stats table shows information about DNS queries requested by the GSLB farm and its responses. It includes the following information:
- Extended DNS Big: The number of EDNS UDP responses that were too large.
- Extended DNS Truncated: The number of EDNS responses that were truncated because they were too long.
- Failed REQ: The number of failed requests from clients.
- Requests: The total number of client requests.
- Failed RES: The number of failed responses to clients.
- Truncated Response TC: The number of responses that were truncated because they were too long. This is indicated to the client by setting the TC bit.
Server
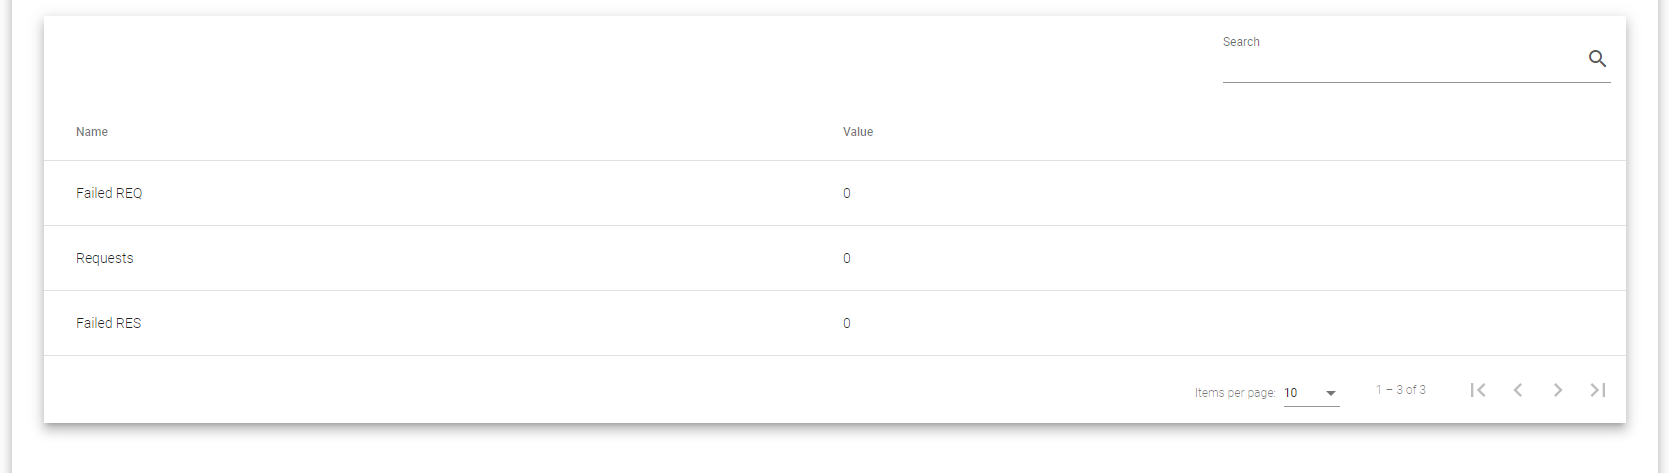
The Server Stats section shows the DNS queries and responses to and from the backend servers. It includes the following information:
- Failed REQ: The number of failed requests from clients.
- Requests: The number of requests that were forwarded to the backend servers.
- Failed RES: The number of failed responses from backend servers.
Extended
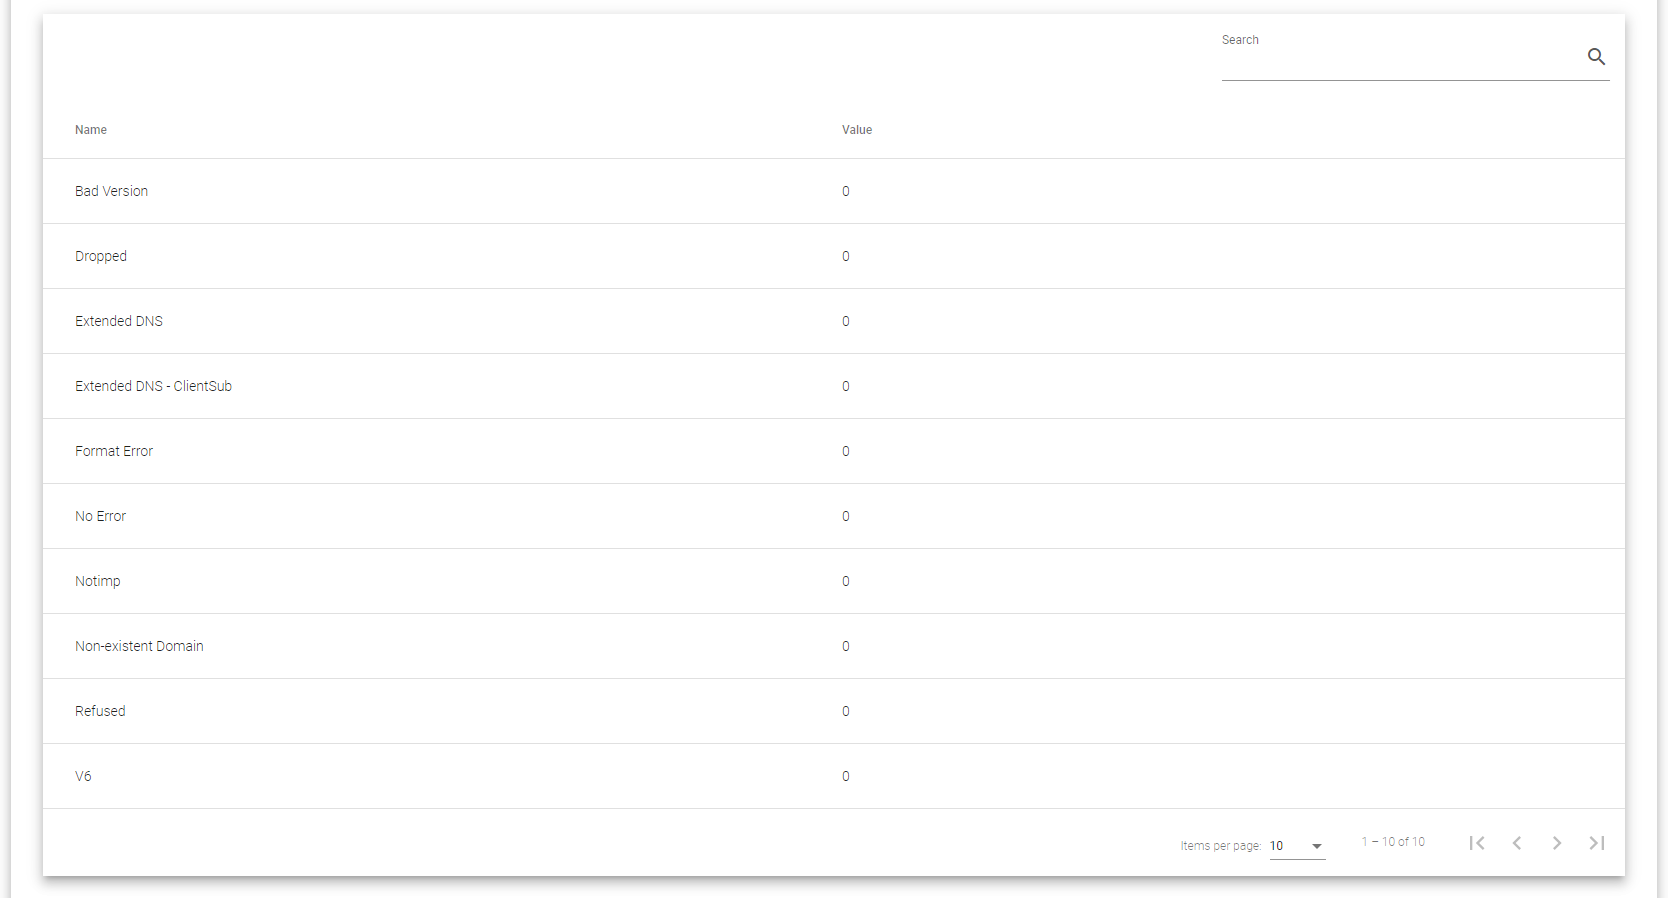
The Extended Stats section shows additional GSLB farm related information. It includes the following information:
- Bad Versions: The number of DNS requests with a wrong DNS version number.
- Dropped: The number of DNS queries that were dropped by DNS servers.
- Extended DNS: The number of DNS queries using EDNS.
- Extended DNS ClientSub: The number of DNS queries using EDNS with client subnet extension.
- Format Error: The number of DNS queries with the wrong format.
- No Error: The number of DNS transactions that were completed.
- Notimp: The number of DNS requests that were answered with a NotImp error: This error means that the DNS server does not implement DNS update requests.
- Non-Existent Domain: The number of DNS queries asking for a domain that cannot be resolved.
- Refused: The number of DNS requests that were refused.
- v6: The number of DNS queries requesting an IPv6 address.
By default, the statistics in this section show a single sample of the information shown for the current farm. However, it is also possible to configure the statistics to update every 10,, 30, 60, or 120 seconds.
Show graphs
This section shows the monitoring graphs and history of both established and pending connections of the active farm in four different time frames, i.e. last day, last week, last month and last year.
Here is an overview of the connections.
Established. These are confirmed connections marked as ESTABLISHED. For GSLB farms, this means the DNS requests are receiving responses from the backends.
Pending. These are connections to the GSLB farm that have not received a response yet from the backends. An increased rate means more requests have not been served.
Each graph also indicates the last value gathered, minimum, maximum and average values.
For more details, refer to the images below.
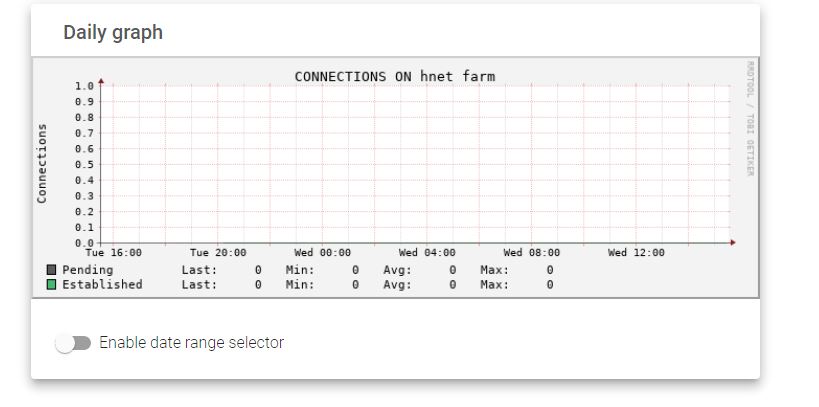
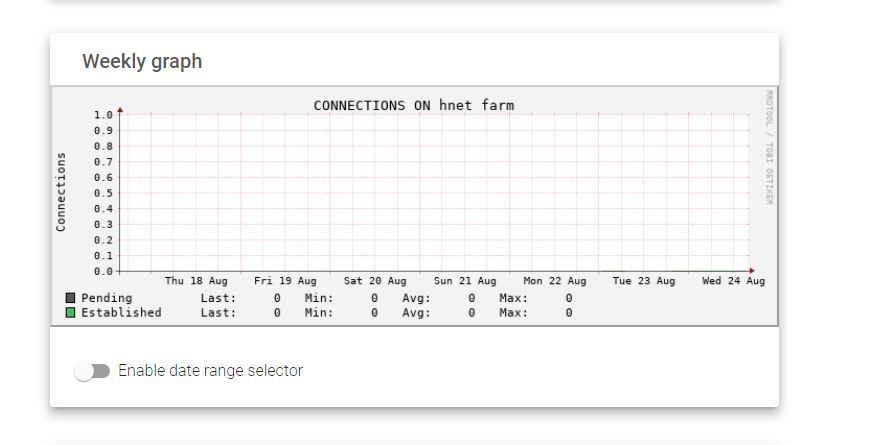
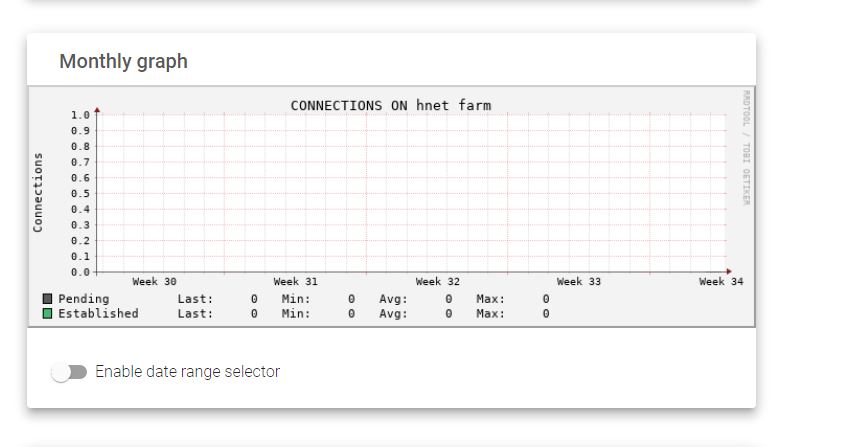
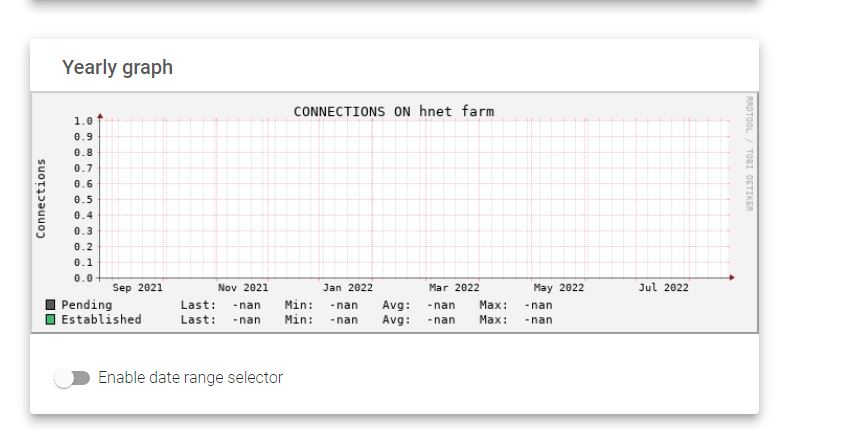
Note You may select a range of statistical data by toggling the Enable data range selector button.
Show IPDS stats
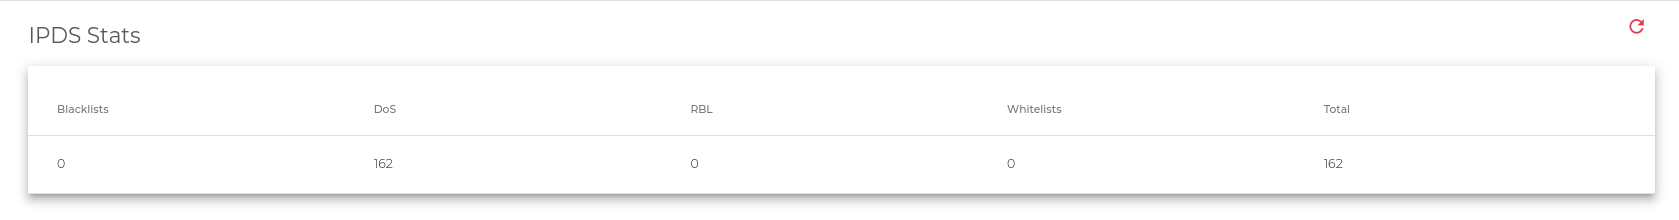
This section shows the stats of the IPDS module
The types of information shown in this view are the following:
- Blacklists: Information related to the number of attacks stopped by this module inside the IPDS system.
- DoS: Information related to the number of attacks stopped by this module inside the IPDS system.
- RBL: Information related to the number of attacks stopped by this module inside the IPDS system.
- Whitelists: Information related to the number of attacks stopped by this module inside the IPDS system.
- Total: A summary of all attacks stopped by all the modules inside the IPDS system.
Next Article: DSLB | Farms
