
Contents
The Reporting section shows the traffic flow on the SKUDONET ADC in different ways. You can see the traffic flow by date, day, week, or month. To further simplify the reporting, the traffic is categorized into different sections separated by the tabs, and these include the IPDS, etc.
IPDS
The IPDS section shows reports about attacks. These are reports on the types of attacks, the source of the attacks, and what rules caught them.
Here’s how to view these reports:
- Click on the Show data menu in the top right corner.
- Choose how you want to see the data (by date, day, week, or month).
- Click on the calendar to pick a date or date range.
- You’ll see graphs about the attacks. Here’s what each graph shows:
Attacks by type of defense: This shows what kind of attacks the system stopped.
Attacks detected by farms: This shows the farm the attacks were directed.
Attacks detected by rules: This shows what rules the system used to catch the attacks.
Top 10 Attacks by URLs: This shows the most common websites used in the attacks.
Attacks by hours: This shows what time of day attacks happened most often.
Here is a brief description of each of these Attacks.
Attacks by type of defense:
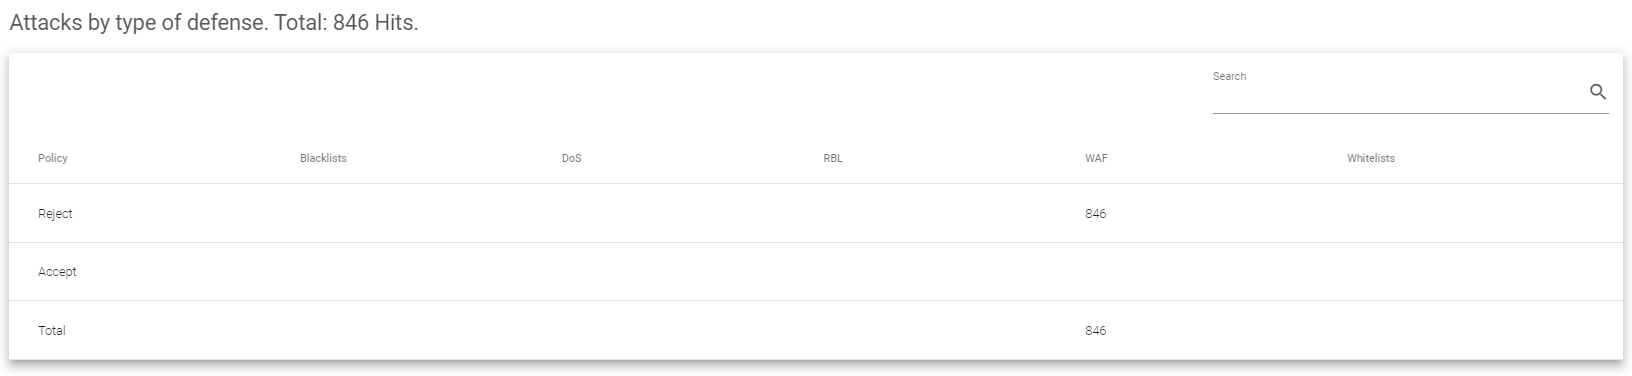
The Attacks by type of defense section the following fields:
- Policy: This shows how the system handled the attacks. It tells you if the attack was blocked (Reject) or allowed (Accept) based on the system’s rules.
- Blacklists: This counts how many attacks came from IP addresses that are known to be bad actors and are listed on a blacklist.
- DoS: This shows how many attacks were Denial of Service attacks.
- RBL: This counts how many attacks came from sources (IP addresses or domains) that are known to send spam.
- WAF: This shows how many attacks tried to exploit weaknesses in web applications. These are especially concerning if they target vulnerabilities listed among the top 10 by OWASP (Open Web Application Security Project).
- Whitelists: This is a bit trickier. It tells you how many attacks originated from IP addresses that are actually allowed on the system. It then shows if those attacks were still blocked (Reject) or allowed (Accept). This helps identify if there might be issues with allowed IPs causing problems.
Attacks detected by farms
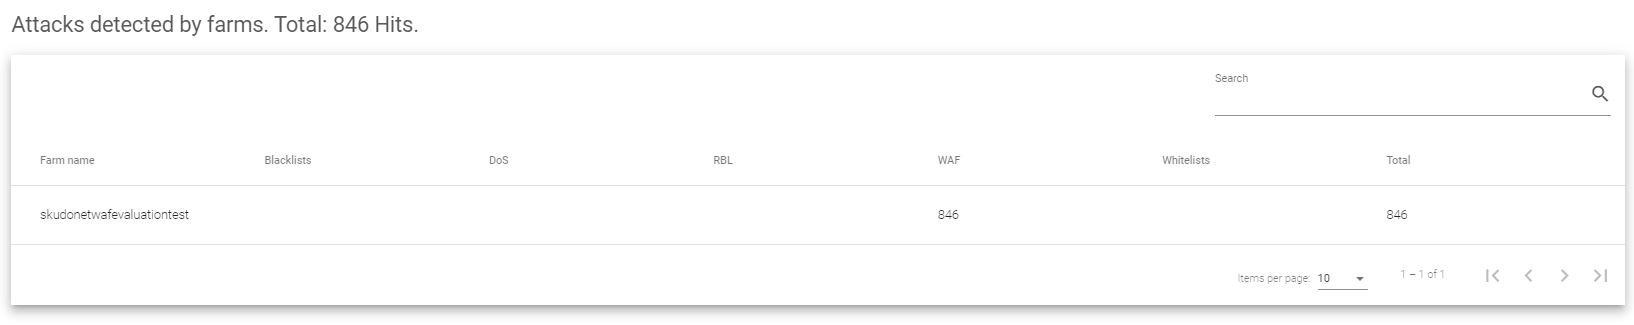
The Attacks detected by Farms section includes the following fields:
- Farm name: This shows which farm the attacks were trying to target.
- Blacklists: This counts how many attacks came from known bad IP addresses and were aimed at this specific farm.
- DoS: This shows how many attacks tried to flood this particular farm with traffic, making it unavailable (Denial of Service attacks).
- RBL: This counts how many spam attempts (emails or content) were directed at this farm, likely from sources known to send spam.
- WAF: This shows how many attacks tried to exploit weaknesses in applications on this farm. It’s especially important if they target vulnerabilities listed among the top 10 by OWASP.
- Whitelists: This shows the total number of attacks that came from allowed IP addresses and were directed at this farm. It helps identify if there might be allowed IPs causing issues for specific farms.
- Total: This simply adds up all the different types of attacks for this particular farm.
Attacks detected by rules
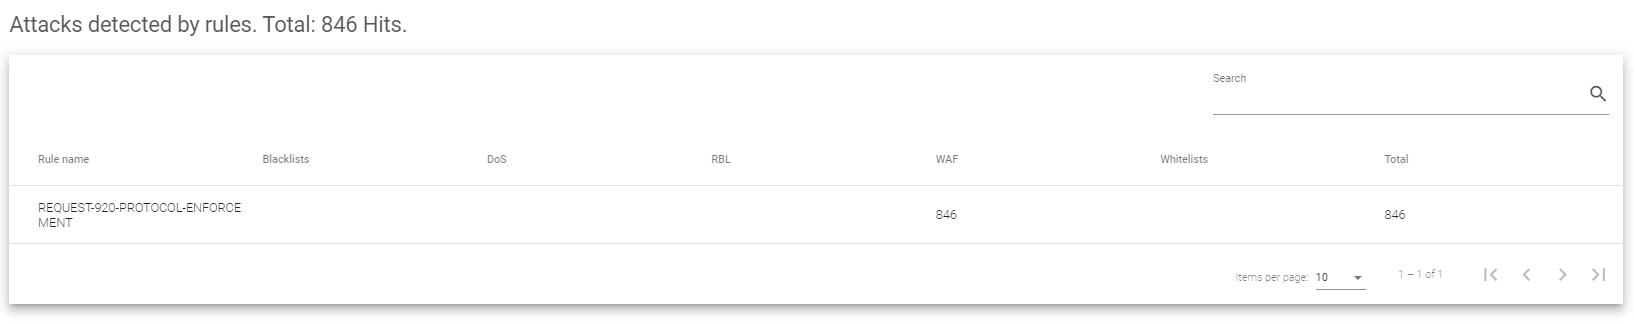
The Attacks detected by rules section includes the following fields:
- Rule name: This tells you the name of the specific rule that blocked the attack. Most of these rules are likely configured within the WAF rulesets.
- Blacklists: This counts how many attacks came from known bad addresses and were stopped by this particular rule.
- DoS: This shows how many Denial of Service attacks were blocked by this specific rule.
- RBL: This counts how many spam attempts (emails or content) were blocked by this rule, likely from sources known to send spam.
- WAF: This shows how many attacks trying to exploit weaknesses in applications were blocked by this particular rule.
- Whitelists: This shows how many attacks originated from allowed IP addresses but were still blocked by this rule. This helps identify if there might be issues with allowed IPs causing problems.
- Total: This simply adds up all the different types of attacks that this particular rule blocked.
Top 10 Attacks by source IP
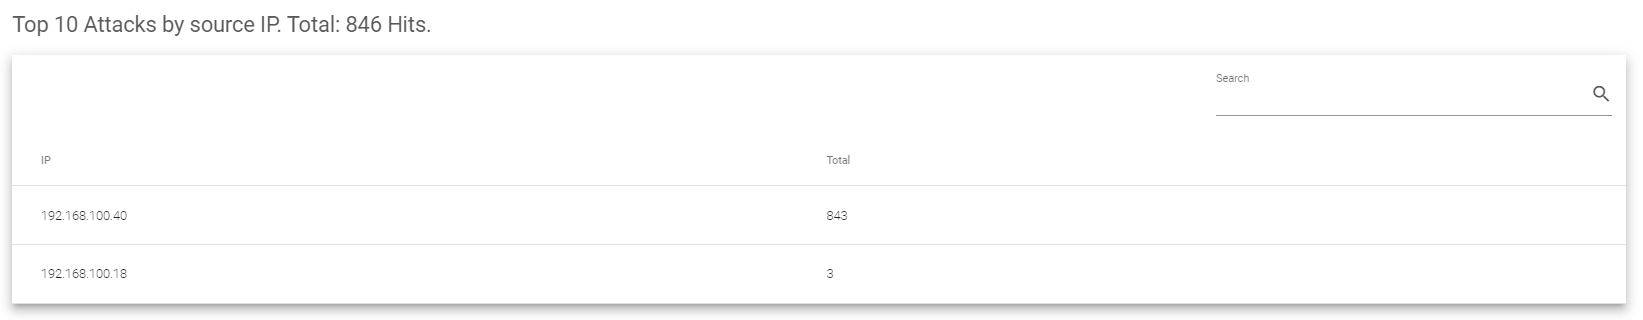
The Top 10 Attacks by source IP section includes the following fields.
- IP: This list shows the top 10 IP addresses that launched the most attacks.
- Total: This shows the total number of attacks that came from each of these top 10 IP addresses. This helps you identify the most frequent attackers.
Top 10 Attacks by URLs.
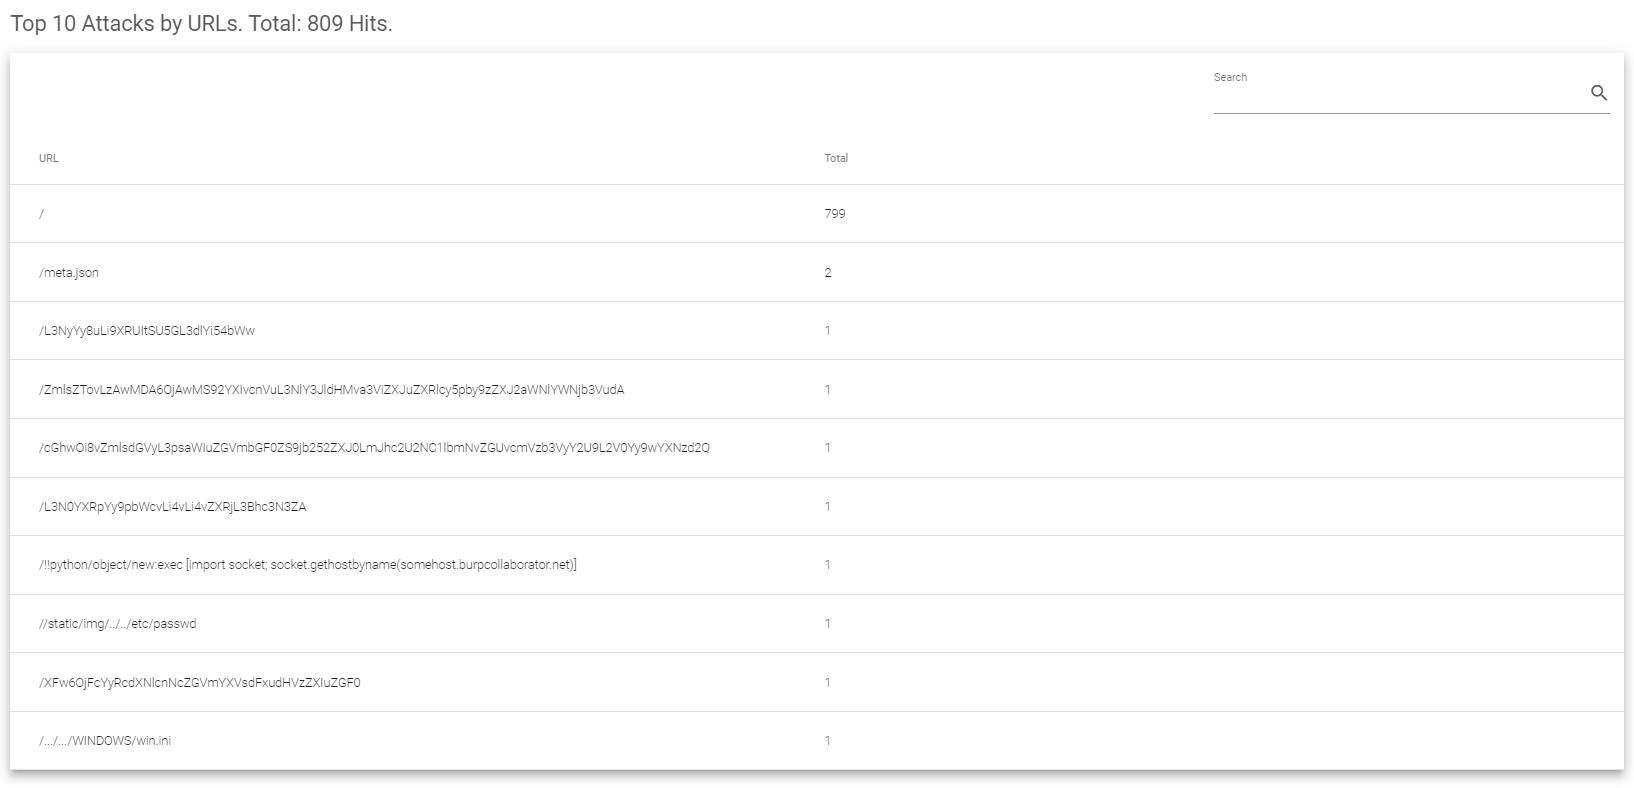
The Top 10 Attacks by URLs section includes the following fields:
- URL: This list shows the top 10 URLs that were most targeted by attacks. From the image you saw earlier, it seems most attacks went after the index page.
- Total: This shows the total number of attacks directed at each of these top 10 URLs. It includes all types of attacks, just like the Top 10 Attacks by source IP section. This helps you identify which web pages were attacked the most.
Attacks by hours
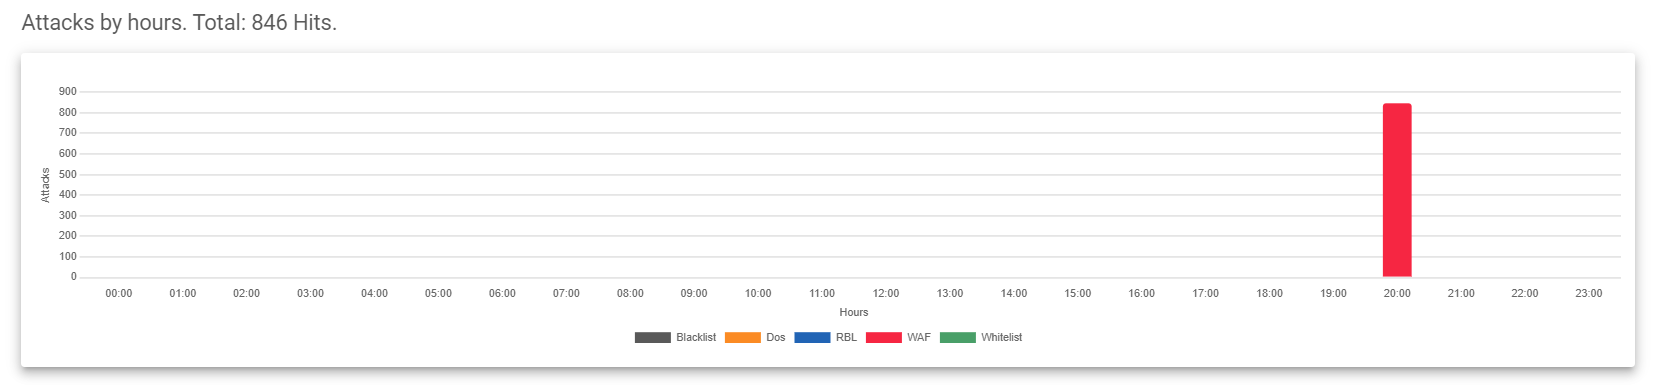
This graph shows how many attacks happened at each hour of the day, and it includes the following.
- Attacks: On the vertical axis, you’ll see the total number of attacks.
- Hours: The horizontal axis shows the specific hour of the day each of these attacks were conducted.
- The color of each bar in the graph tells you what type of attack it was:
- Black: Blacklisted attacks.
- Orange: Denial-of-Service (DoS) attacks.
- Blue: Role-based blocklists.
- Red: Web Application Firewall (WAF) attacks.
- Green: Whitelisted attacks.
Printing the Report
Once you’ve generated the report, you have several options:
- Print the report directly for a physical copy.
- Save a copy as a PDF or XPS document for easy sharing or future reference.
Generating the report is simple: just click the print button located at the top of the page and follow the prompts.
