Contents
An introduction to SNMP
SNMP or Simple Network Management Protocol is an application layer protocol defined by the IETF in its current amended RFC 1157. SNMP bases its data representation on an ASN.1 (presentation layer protocol) modification, defined also by the IETF in the RFC 1065 as SMI (Structure and Identification of Management Information).
SNMP allows two ways of working, synchronous (or polling) and asynchronous. The synchronous mode is the most common way of using SNMP, it works by sending PDUs (Protocol Data Units) to managed devices which implement SNMP in the network, those PDU could be for data retrieval (GetRequest) which requires a response from the device (GetResponse) or to set a value in a specific object (SetRequest).
SNMP in asynchronous mode works by the use of traps. Traps are unsolicited alert PDUs sent by the managed device to a central trap collector station, those traps are the indicator that a critical event has happened in the monitored device, for example, overheating or too much memory usage and are directed to the UDP port 162.
MIB – Management Information Base
Each object which could be managed by SNMP is grouped hierarchically and represented in a special file called MIB files, those MIBs are descriptors of groups of managed objects organized under a tree of OIDs (Object Identifiers) which uniquely identifies each object.
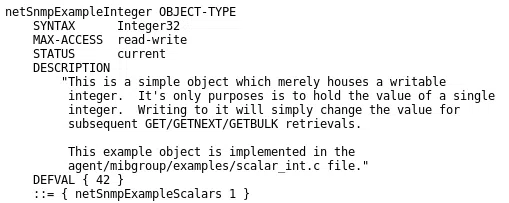
We can see an example of MIB content in the following picture:
One of the most common MIB files is defined by the IETF in the MIB-II.
SNMP – Architecture
SNMP defines 3 types of entities in its architecture:
Network Management Stations: Execute management applications to control and monitor the network elements.
Network elements: Devices such as a SKUDONET Load Balancer which will be monitored by the network management station.
Agents: Software responsible for executing orders sent by the network management stations, like retrieving the value of a specific OID.
Configuring SNMP in SKUDONET Appliances
SKUDONET appliances come with an SNMP agent implemented on it allowing the Debian GNU/Linux default OIDs to be polled synchronously by a network management station to control the state of the load balancer.
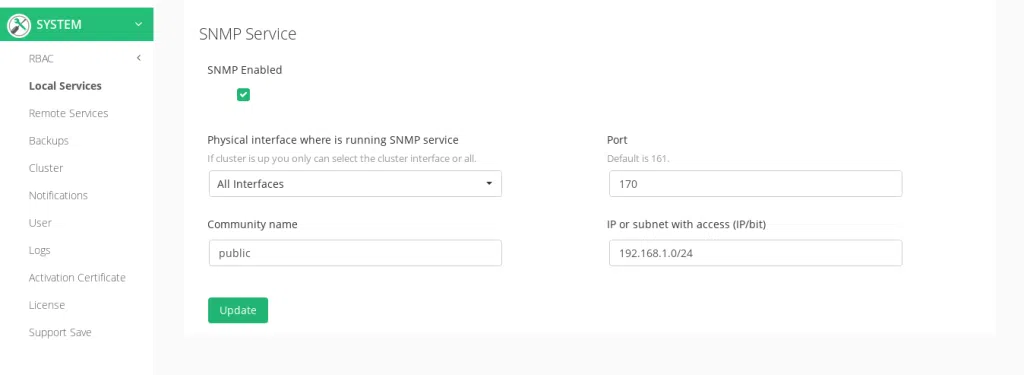
Configure SNMP in SKUDONET appliances, it could be done easily through the web GUI as follows:
1. Navigate to the appliance web GUI and go to the section System > Local Services on the sidebar:
2. Enable the SNMP checkbox and configure the interface from which the incoming requests will be allowed. It’s recommended to set up here the management interface.
3. We can change the listening port and the community name, notice that such a name is required when requesting an OID and should be included in the request.
4. The last field is the IP address or subnet from which the service will allow incoming requests.
With this service, your application delivery can be monitored in a centralized SIEM platform to ensure the right traffic behaviour.
Please find below some useful SNMP OIDs to monitor properly a load balancer. Note that there are a lot of different OIDs to use, so we recommend using a tool like snmptranslate to translate them to a more understandable name for network managers.
SNMP OIDs for Memory Statistics
Use the following OIDs for SKUDONET Appliances to get different memory stats:
memTotalSwap: Total swap space configured for the host in kB (.1.3.6.1.4.1.2021.4.3.0)
memAvailSwap: Swap space currently available in kB (.1.3.6.1.4.1.2021.4.4.0)
memAvailSwap: Real memory installed on the host in kB (.1.3.6.1.4.1.2021.4.5.0)
memAvailReal: Real memory available in kB (.1.3.6.1.4.1.2021.4.6.0)
memTotalFree: Total of free memory in kB (.1.3.6.1.4.1.2021.4.11.0)
memShared: Total of real or virtual memory allocated for use as shared memory in kB (.1.3.6.1.4.1.2021.4.13.0)
memBuffer: Total of real or virtual memory allocated for use as memory buffer in kB (.1.3.6.1.4.1.2021.4.14.0)
memCached: Total of real or virtual memory allocated for use as cache memory in kB (.1.3.6.1.4.1.2021.4.15.0)
SNMP OIDs for CPU Load Statistics
Use the following OIDs for SKUDONET Appliances to get the CPU load values:
1 minute CPU Load (.1.3.6.1.4.1.2021.10.1.3.1)
5 minute CPU Load (.1.3.6.1.4.1.2021.10.1.3.2)
15 minute CPU Load (.1.3.6.1.4.1.2021.10.1.3.3)
SNMP OIDs for CPU Statistics
Use the following OIDs for SKUDONET Appliances to get the CPU stats:
SsCpuSystem: percentages of system CPU processing system-level time (.1.3.6.1.4.1.2021.11.10.0)
ssCpuRawSystem: Ticks spent in system-level code (.1.3.6.1.4.1.2021.11.52.0)
ssCpuIdle: Percentage of processor time in idle state (.1.3.6.1.4.1.2021.11.11.0)
ssCpuRawIdle: Ticks spent idly by cpu (.1.3.6.1.4.1.2021.11.53.0)
SNMP OIDs for Network Interfaces Statistics
Use the following OIDs for SKUDONET Appliances to get the network interface stats:
ifNumber: Number of interfaces in the system (1.3.6.1.2.1.2.1)
interfaces: table for interfaces statistics (1.3.6.1.2.1.2.2)
This OID corresponds with a table in the MIB2. Note that tables are different in their representation than scalar objects. Imagine a table with an OID xTable, with columns Coli and index i, to gain access to the column Col1 and index 1, we should request a snmpget for xTable.xEntry.Col1.1, where xEntry has only a conceptual meaning, we can also get all entries of a column Col1 with an snmpwalk to xTable.xEntry.Col1 or get the full table with a snmpwalk to its OID (xTable.xEntry). Lets what we get as columns:
ifDescr: Interfaces names (1.3.6.1.2.1.2.2.1.2)
ifType: Interfaces type, for example, ethernet (1.3.6.1.2.1.2.2.1.3)
ifMtu: Maximum Transfer Unit (1.3.6.1.2.1.2.2.1.4)
ifSpeed: Current estimated or nominal bandwidth in b/s (1.3.6.1.2.1.2.2.1.5)
ifPhysAddress: lower protocol layer address, for example, MAC address (1.3.6.1.2.1.2.2.1.6)
ifOperStatus: Current status (1.3.6.1.2.1.2.2.1.8)
ifInOctets: Number of incoming octets (1.3.6.1.2.1.2.2.1.10)
ifInUcastPkts: Number of incoming unicast packets (1.3.6.1.2.1.2.2.1.11)
ifInDiscards: Number of inbound packets discarded (1.3.6.1.2.1.2.2.1.13)
ifInErrors: Number of inbound packets with errors preventing them to be delivered (1.3.6.1.2.1.2.2.1.14)
ifOutOctets: Number of transmitted octets (1.3.6.1.2.1.2.2.1.16)
ifOutUcastPkts: Number of transmitted unicast packets (1.3.6.1.2.1.2.2.1.17)
ifOutDiscards: Number of transmitted packets discarded (1.3.6.1.2.1.2.2.1.19)
ifOutErrors: Number of outgoing packets with errors which couldn’t be transmitted (1.3.6.1.2.1.2.2.1.20)
Backends SNMP monitoring from the load balancer
On the other hand, SNMP is very useful in a load balancer point of view as it could be used to gather backend metrics and use them to change the scheduler behaviour or to automate the activation and deactivation of backends. Refer to this link to get more information about how to use a custom farm guardian check with SNMP.
Further application delivery monitoring
There are use cases where it’s needed to get specific monitoring values like the farms, backends or clustering statistics and states. To gather these specific values, please follow this article it can also be done through the REST api.
Hope that you find this article useful and that it takes you to the next level of using SNMP to monitor SKUDONET Appliances!


